Physical Address
304 North Cardinal St.
Dorchester Center, MA 02124

#angular #nodejs #kubernetes #typescript #nestjs #agency #cloud #ai
#angular #nodejs #kubernetes #typescript #nestjs #agency #cloud #ai
If you’ve searched for a good way to deploy Freqtrade on Kubernetes, you’ve probably seen the same pattern over and over:
You can get something running, but getting something clean, reusable, and easy to understand is another story.
That was the gap we wanted to close.
We built the OTWLD Freqtrade Helm Chart because we wanted a version of Freqtrade on Kubernetes that didn’t feel like a pile of YAML glued together over three late nights. We wanted something you could install fast, understand quickly, and extend without regretting it a week later.
So that became the bar:
That’s what this chart is.

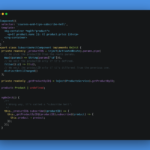
Freqtrade Helm Chart dashboard running on Kubernetes
This is a Helm chart for people who want to run Freqtrade, not spend hours reverse-engineering a chart before they can trust it.
With this chart, you can:
That’s the value. Less setup friction, fewer moving pieces to invent yourself, and a much faster path from “I want to try this” to “it’s running.”
A lot of infrastructure projects are technically flexible but practically annoying. They give you infinite knobs and no clear starting point.
We went the other way.
The OTWLD Freqtrade Helm Chart ships with example configs for the setups people actually want:
minimal.yaml for a quick first installdashboard-and-bots.yaml for a shared UI plus multiple botsrecommended-fleet.yaml for a more production-style baselinepublic-dashboard.yaml for graphing and shared visibilityprivate-bot-ui.yaml for private operator accessstrategy-init-sync.yaml for Git-based strategy deliveryexternal-secret.yaml for secret-manager driven setupsThat means you’re not starting from theory. You’re starting from a working pattern.
One of the main reasons to run Freqtrade this way is that the dashboard story is much cleaner.
Instead of treating every bot as a one-off service you manually babysit, you can run a shared dashboard for FreqUI and graphing, then manage bots behind it in a more organized way.
That gives you a setup that feels much closer to a real system:
For people running more than one bot, this matters immediately.
Good deployment UX is not just about install commands. It’s about not getting tripped up by dumb problems later.
So we hardened the chart around the stuff that wastes time in real deployments:
user_dataIn v0.3.3, we specifically tightened persistence and UI-related behavior so deployments are less likely to fail in confusing ways. That’s not glamorous release-note material, but it’s exactly the kind of work that makes a chart actually usable.
If your goal is simply to get started fast, the install flow is straightforward:
helm repo add otwld https://helm.otwld.com/
helm repo update
helm upgrade --install freqtrade otwld/freqtrade \
  --namespace freqtrade \
  --create-namespace \
  -f values.yaml
From there, pick the example closest to what you want and adapt it.
If you just want to see it work, start with the minimal example.
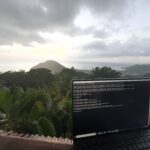
If you want to understand the real value of the chart, start with the recommended fleet example.

Suggested alt text: Recommended Freqtrade fleet deployment on Kubernetes
We built this because we wanted it ourselves.
We wanted a Freqtrade Helm chart that felt like it had already done the thinking most users end up doing on their own: storage, examples, FreqUI, bot isolation, secrets, sensible defaults, and a layout that makes sense when you come back to it later.
There’s still plenty we can improve, but the important part is this: it’s already useful.
If you want to run Freqtrade on Kubernetes without building your own chart from scratch, this gets you there faster and with a lot less friction.
The chart is available here:
If you end up using it, copy an example, replace it with your own config, and ship. That’s the whole point.
If you want the fastest path without building your own manifests, a Helm chart is the best option. The OTWLD Freqtrade Helm Chart gives you a clean install flow, persistent storage, FreqUI support, and example configs you can use immediately.
Yes. The chart is built around a shared dashboard and isolated bots[], so you can run one bot or a small fleet in the same Helm release.
Yes. The chart supports a shared dashboard for FreqUI and graphing, which is one of the main reasons to use it instead of managing separate one-off deployments.
Yes. That’s one of the strongest parts of the project. It ships with examples for minimal installs, shared dashboards, recommended fleets, public dashboards, private bot UIs, Git-based strategy sync, and external secret setups.
Yes, especially if you want a cleaner baseline with persistent volumes, isolated bots, private bot APIs, and a more maintainable Helm-based workflow.


The focus on a clean, reusable Freqtrade Helm chart is helpful; that’s the part most “just get it running” Kubernetes examples miss. For production use, how do you recommend handling secrets, persistent state/backups, Helm upgrade/rollback, and default observability in this chart?
Nice to see this framed as a reusable Helm chart rather than a pile of YAML; that’s exactly where Freqtrade-on-Kubernetes setups tend to get messy. For production installs, how do you recommend handling chart defaults around secrets, persistent volumes/backups, probes/resources, observability, and upgrade/rollback flow?
Nice to see Freqtrade packaged as a Helm chart instead of a pile of YAML; that reuse/understandability matters once it hits a real cluster. For production installs, how does the chart expect teams to handle secrets, persistent storage/backups, resource limits, upgrades, and example values for ingress/cert-manager?
I get why the OTWLD Helm Chart is cleaner than a pile of YAML, and for people already running k8s it probly makes sense. But for many Freqtrade users, Kubernetes feels like extra moving parts before the bot itself is even stable. A single VPS with Docker Compose is often easier to reason about until scaling, isolation, or GitOps really matter. What would you say is the first concrete point where Compose stops being enough?
Nice write-up 🙂 I like the goal of making the OTWLD Freqtrade Helm Chart feel less like “YAML glued together”. I’m trying to keep exchange/strategy bits in separate values files and leave infra defaults reusable across bots; is that the pattern you’d recommend for keeping deployments maintainable after the first one?
I have been playing here for a week now and the payouts are legit. Love the variety of games available. Best experience so far! phnustargame
Best place for slots and live games. I had a small issue with my deposit but the customer service fixed it in minutes. Keep it up taya789
The variety of games here is insane. I never get bored because there is always something new to try. Definitely my new favorite sz777casino